
Check prices and usage
Inside the Console you can check model list prices, what is left of your plan’s allowance, how long the current conversation is, and what your tokens went on. Turn on RTK to use fewer tokens.
How it works
Section titled “How it works”| What you want to see | Where to look |
|---|---|
| A model’s list price | The model lists of the launch dialog and the settings |
| How much of your plan’s allowance is left | The usage chips on the WS bar |
| How much context the current conversation uses | The “Context” gauge in the session view |
| What your tokens went on | ⚙Settings → Agent usage |
| How much RTK saved | “rtk savings” in ⚙Settings → Agent usage |
See model list prices
Section titled “See model list prices”Model lists show each model’s API list price (input / output per million tokens) and its context length. Under the selected model, the cache-read rate and the release date appear too.
- The figures are what models.dev publishes: the list price when you pay for the API per use
- They are not what claude, codex or agy bill you on a subscription. For opencode they are the prices opencode actually charges
- Models codex has announced it will retire, and models models.dev marks deprecated, carry “Retiring”
- They are not shown for cursor, muse and lcpp models, or for claude tier names (Opus and so on). A full claude ID you registered does show them
See what is left of your allowance
Section titled “See what is left of your allowance”Agents whose account allowance can be read get a usage chip on the WS bar. Which ones do is the “Usage / remaining-quota chip” row of the Agents reference.
- Only the two most recently used stay on the bar. The rest fold into “+N” on the right; press it to open them
- A folded chip keeps reading its usage, so opening “+N” costs no fresh fetch
- A chip nearing its cap (95% or more, say) or holding a Full reset comes out even if you have not used that agent lately
- On a phone they stack inside ”⋯” and do not fold
Choose how a chip is shown under “On the WS bar” in its dropdown.
| Choice | How it is shown |
|---|---|
| Always show | Always on the bar, even when not used lately |
| Auto (default) | On the bar only while it is one of the recently used agents |
| Always fold | Always inside “+N”. It does not come out even near its cap |
To keep a third chip on the bar all the time, choose “Always show”.
See how long the conversation is
Section titled “See how long the conversation is”Agents with a context gauge show a “Context” gauge (ctx when narrow) at the top of the session view.
- Hover it for the tokens in use and the limit, broken down into cache reuse, new cache and uncached
- Near the limit it warns “May be auto-compacted soon”
- The chat view also shows how token use moved turn by turn
If, in a long piece of work, the agent suddenly seems to have forgotten earlier context, look here. Which agents have the gauge is the “Context usage gauge” row of the Agents reference.
See what your tokens went on
Section titled “See what your tokens went on”⚙Settings → Agent usage is the ledger of what your tokens went on. Besides the sessions themselves, it lists on the same scale what Agent Fleet calls behind the scenes (title suggestions, summarised handoffs, reply suggestions and so on).
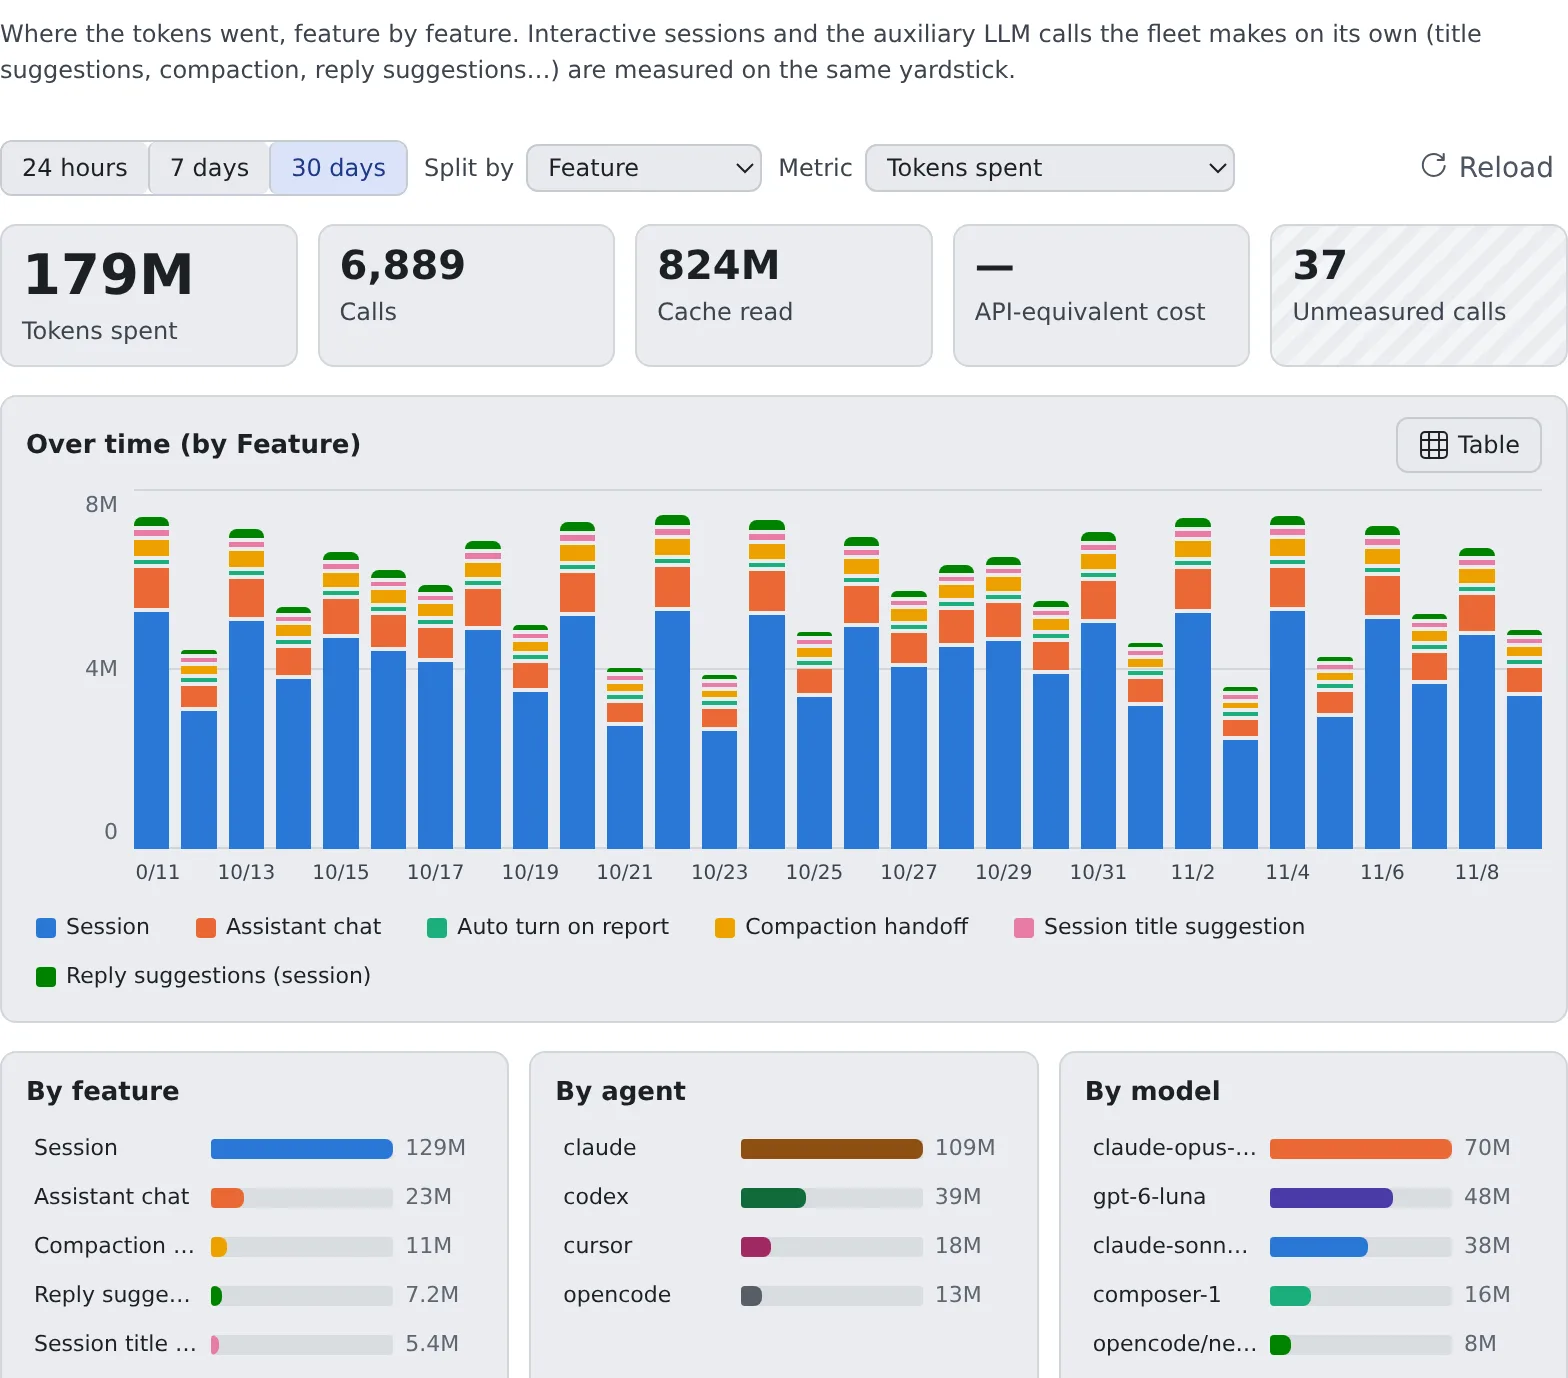
| Item | Choices |
|---|---|
| Period | 24 hours, 7 days, 30 days |
| Split by | Feature, Agent, Model, Session origin, Trigger |
| Metric | Tokens spent, Calls, Cache read, API-equivalent cost (est.) |
- Click a series in the chart to filter to it. There is also a “Feature × model” table
- “What is measurable” lists calls that report no tokens as counted only. That does not mean they used nothing
Read the API-equivalent cost
Section titled “Read the API-equivalent cost”The API-equivalent cost (est.) is a guide: tokens times each model’s published API rate, shown with a ≈.
It is not what a subscription bills you. It shows what this use would have cost on the API.
- Cache writes are priced at 1.25 times the rate, cache reads at 0.1 times
- Rates for Anthropic models come from a built-in table, the rest from the models.dev catalog. The Agent fetches the catalog once a day; where it cannot, it reads the copy opencode keeps. Use through opencode is priced at opencode’s rates
- Hover an amount to see which rate was used and where it came from. For claude’s auxiliary calls and opencode sessions, the amount the agent reported appears too (it is not added to the estimate)
- Models missing from the catalog are not estimated. It says “N% of the consumption (… tokens) runs on models with no price on file”, and that share is left out of the estimate
- The catalog’s date shows too. A newer catalog changes past estimates as well
Cursor’s tokens
Section titled “Cursor’s tokens”Terminal (CLI) cursor sessions record their tokens per turn and show “Tokens: partial”.
- The figures are cursor’s own report
- A turn on Auto is recorded under the model name
default - Managed cursor sessions are not counted
Save tokens with RTK
Section titled “Save tokens with RTK”Many agent cards have an “RTK (token savings)” on / off. It rewrites the commands an agent runs so that their output uses fewer tokens.
How it works differs by agent.
- Agents whose commands are rewritten every time: it always applies
- Agents that are only asked to use rtk through
AGENTS.md: whether they do is up to the agent (best effort)
Which agent is which is in the “RTK (token savings)” row of the Agents reference and its footnote.
- When the workspace image has no RTK, it says “This workspace has no rtk.”
- See the savings under “rtk savings” in ⚙Settings → Agent usage: the total, the average saving rate and the number of commands, by day, week or month
Related
Section titled “Related”- Choose an agent
- See running time and cloud cost: what the workspace itself costs